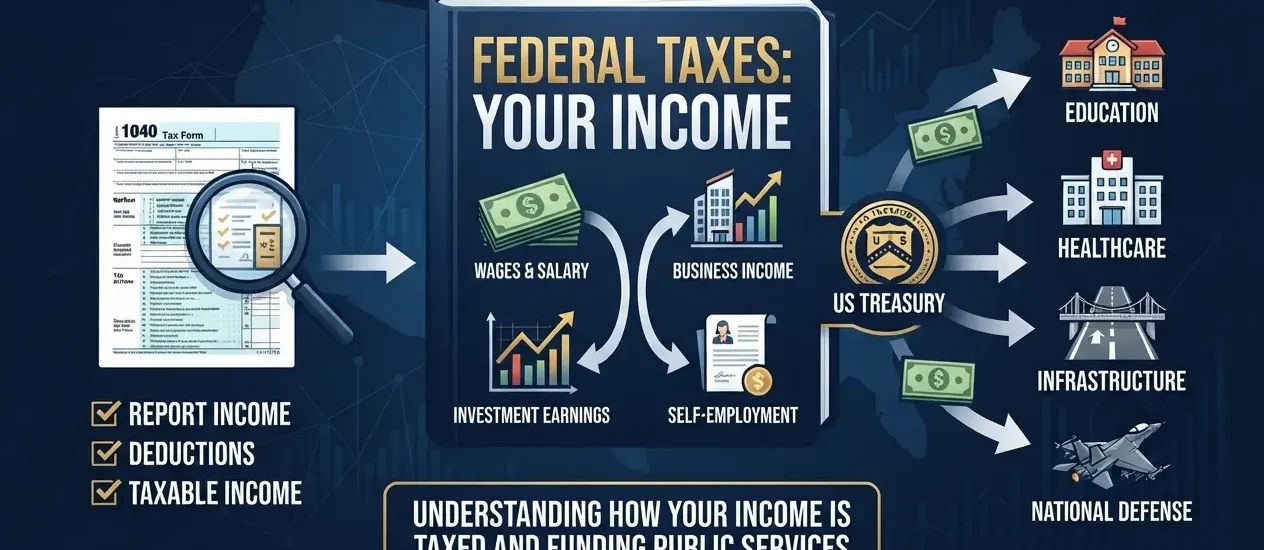
If you’ve typed “federal taxes income brackets” into Google, you’re probably trying to answer one simple question: how much of my paycheck actually goes to the IRS in 2026? The honest answer is “it depends on your filing status and where your income falls,” but once you see the numbers laid out, it stops being confusing.
The IRS released the official 2026 brackets in October 2025 under Revenue Procedure 2025-32, and the One Big Beautiful Bill Act (OBBBA) locked in the current seven-rate structure instead of letting it expire. Below, you’ll find every bracket for every filing status, the 2026 standard deduction, real worked examples, and the mistakes that trip people up most often
For 2026, the federal government still uses seven tax rates:
10%, 12%, 22%, 24%, 32%, 35%, and 37%
What did change is where each bracket starts and ends. The IRS adjusts these dollar thresholds every year for inflation using the Chained Consumer Price Index (C-CPI-U), so the brackets got a bit wider for 2026 even though the rates themselves stayed put.2026 Federal Tax Brackets by Filing Status
| Tax Rate | Taxable Income From | Up To |
|---|---|---|
| 10% | $0 | $12,400 |
| 12% | $12,401 | $50,400 |
| 22% | $50,401 | $105,700 |
| 24% | $105,701 | $201,775 |
| 32% | $201,776 | $256,225 |
| 35% | $256,226 | $640,600 |
| 37% | $640,601 | and up |
| Tax Rate | Taxable Income From | Up To |
|---|---|---|
| 10% | $0 | $24,800 |
| 12% | $24,801 | $100,800 |
| 22% | $100,801 | $211,400 |
| 24% | $211,401 | $403,550 |
| 32% | $403,551 | $512,450 |
| 35% | $512,451 | $768,700 |
| 37% | $768,701 | and up |
| Tax Rate | Taxable Income From | Up To |
|---|---|---|
| 10% | $0 | $17,700 |
| 12% | $17,701 | $67,450 |
| 22% | $67,451 | $105,700 |
| 24% | $105,701 | $201,750 |
| 32% | $201,751 | $256,200 |
| 35% | $256,201 | $640,600 |
| 37% | $640,601 | and up |
| Tax Rate | Taxable Income From | Up To |
|---|---|---|
| 10% | $0 | $12,400 |
| 12% | $12,401 | $50,400 |
| 22% | $50,401 | $105,700 |
| 24% | $105,701 | $201,775 |
| 32% | $201,776 | $256,225 |
| 35% | $256,226 | $384,350 |
| 37% | $384,351 | and up |
Source: IRS Revenue Procedure 2025-32, effective for the 2026 tax year (returns filed in early 2027).
Here’s the misconception that costs people the most sleep: landing in the 24% bracket does not mean the IRS takes 24% of your entire income. Only the portion of income that falls inside that bracket is taxed at that rate. Everything below it is still taxed at the lower rates that came before.
Example — Single filer with $150,000 of taxable income in 2026:
Total federal tax: $28,598 — an effective rate of about 19.1%, even though the marginal (top) rate is 24%.
That gap between your marginal rate and your effective rate is normal, and it’s the reason a raise or bonus rarely “costs” as much in taxes as people fear. A $5,000 bonus taxed at your 24% marginal rate costs you $1,200, not 24% of your whole paycheck.
Before any bracket applies, most taxpayers subtract the standard deduction from their income to get to “taxable income.” For 2026:
| Filing Status | Standard Deduction |
|---|---|
| Single / Married Filing Separately | $16,100 |
| Married Filing Jointly | $32,200 |
| Head of Household | $24,150 |
Taxpayers who are 65 or older, or blind, get an extra $2,050 (unmarried) or $1,650 per spouse (married) on top of these amounts.
Why this matters: your tax bracket is based on taxable income, not gross salary. A single filer earning $70,000 in wages with no other adjustments has taxable income of $70,000 − $16,100 = $53,900 — which keeps more of their income in the lower brackets than the gross number suggests.
| Filing Status | 2025 Top of 12% Bracket | 2026 Top of 12% Bracket |
|---|---|---|
| Single | $48,475 | $50,400 |
| Married Filing Jointly | $96,950 | $100,800 |
| Head of Household | $64,850 | $67,450 |
The brackets widened by roughly 2.4–4% depending on the tier, meaning most households will owe slightly less federal tax on the same income in 2026 than they would have on identical income in 2025. That said, if your income grew faster than inflation, this “bracket creep” relief can still be outpaced by your own raise.
A married couple with $250,000 of taxable income in 2026:
Total federal tax: $45,196 — an effective rate of 18.1%, with a 24% marginal rate.
Q: Do the 2026 tax brackets apply to the return I file in April 2026?
No, The 2026 brackets apply to income earned during calendar year 2026, reported on the return filed in early 2027. The return due in April 2026 covers 2025 income and uses the 2025 brackets.
Q:Did tax rates increase for 2026?
No, The seven rates (10% to 37%) stayed the same. Only the dollar thresholds inside each bracket moved up for inflation.
Q:What’s the difference between marginal and effective tax rate?
Marginal rate is what you pay on your next dollar of income. Effective rate is your total tax divided by your taxable income — almost always lower than your marginal rate because of the layered bracket system.